1998 Illinois elections
|
| ← 1996 | November 3, 1998 | 2000 → |
|
| Turnout | 52.43% |
|---|
| |
| Elections in Illinois |
|---|
 |
| |
| General elections |
|---|
| | | Gubernatorial elections |
|---|
| | | Lieutenant Gubernatorial elections |
|---|
| | | Attorney General elections |
|---|
| | | Secretary of State elections |
|---|
| | | Comptroller elections |
|---|
| | | Senate elections |
|---|
| | | House of Representatives elections |
|---|
| | | Judicial elections |
|---|
| |
|
Ballot measures and referendums |
| |
| |
| |
|
Elections were held in Illinois on Tuesday, November 3, 1998. Primary elections were held on March 17, 1998.[1]
These elections saw Democrats make gains. The Democratic Party went from holding no statewide offices, to holding two.
Election information
1998 was a midterm election year in the United States.
Turnout
Primary election
For the primary election, turnout was 27.04%, with 1,824,806 votes cast.[2]
- Turnout by county[2]
| County | Registration | Votes cast | Turnout |
| Adams | 39,753 | 8,380 | 21.08% |
| Alexander | 7,519 | 3,603 | 47.92% |
| Bond | 9,811 | 1,793 | 18.28% |
| Boone | 22,061 | 7,131 | 32.32% |
| Brown | 3,271 | 2,029 | 62.03% |
| Bureau | 25,112 | 7,924 | 31.55% |
| Calhoun | 3,798 | 1,220 | 32.12% |
| Carroll | 10,905 | 3,842 | 35.23% |
| Cass | 9,649 | 4,374 | 45.33% |
| Champaign | 115,156 | 21,566 | 18.73% |
| Christian | 23,603 | 8,173 | 34.63% |
| Clark | 12,084 | 3,727 | 30.84% |
| Clay | 10,087 | 2,676 | 26.53% |
| Clinton | 24,358 | 2,950 | 12.11% |
| Coles | 29,461 | 9,289 | 31.53% |
| Cook[note 1] | 2,721,334 | 780,580 | 28.68% |
| Crawford | 13,381 | 3,772 | 28.19% |
| Cumberland | 7,915 | 2,686 | 33.94% |
| DeKalb | 45,534 | 8,651 | 19% |
| DeWitt | 11,513 | 2,244 | 19.49% |
| Douglas | 11,281 | 2,319 | 20.56% |
| DuPage | 460,688 | 113,345 | 24.6% |
| Edgar | 13,029 | 3,149 | 24.17% |
| Edwards | 5,143 | 2,380 | 46.28% |
| Effingham | 19,711 | 6,133 | 31.11% |
| Fayette | 13,422 | 3,850 | 28.68% |
| Ford | 8,384 | 4,543 | 54.19% |
| Franklin | 30,636 | 13,688 | 44.68% |
| Fulton | 25,999 | 9,500 | 36.54% |
| Gallatin | 4,731 | 2,812 | 59.44% |
| Greene | 8,923 | 2,801 | 31.39% |
| Grundy | 22,468 | 5,960 | 26.53% |
| Hamilton | 6,379 | 3,415 | 53.54% |
| Hancock | 12,821 | 4,967 | 38.74% |
| Hardin | 3,743 | 2,417 | 64.57% |
| Henderson | 5,324 | 2,154 | 40.46% |
| Henry | 32,819 | 7,881 | 24.01% |
| Iroquois | 18,397 | 5,591 | 30.39% |
| Jackson | 44,300 | 10,881 | 24.56% |
| Jasper | 7,547 | 3,862 | 51.17% |
| Jefferson | 25,924 | 7,253 | 27.98% |
| Jersey | 13,964 | 4,029 | 28.85% |
| Jo Daviess | 14,413 | 2,827 | 19.61% |
| Johnson | 7,120 | 3,676 | 51.63% |
| Kane | 177,041 | 51,342 | 29.00% |
| Kankakee | 57,482 | 8,217 | 14.29% |
| Kendall | 31,224 | 7,430 | 23.8% |
| Knox | 34,117 | 7,757 | 22.74% |
| Lake | 316,111 | 78,977 | 24.98% |
| LaSalle | 65,229 | 16,659 | 25.54% |
| Lawrence | 11,336 | 2,834 | 25.00% |
| Lee | 20,431 | 6,332 | 30.99% |
| Livingston | 22,714 | 8,902 | 39.19% |
| Logan | 18,665 | 7,589 | 40.66% |
| Macon | 72,319 | 20,844 | 28.82% |
| Macoupin | 35,243 | 10,428 | 29.59% |
| Madison | 164,136 | 34,057 | 20.75% |
| Marion | 28,158 | 7,408 | 26.31% |
| Marshall | 8,386 | 1,684 | 20.08% |
| Mason | 10,598 | 2,214 | 20.89% |
| Massac | 12,435 | 3,454 | 27.78% |
| McDonough | 18,536 | 4,658 | 25.13% |
| McHenry | 142,461 | 39,492 | 27.72% |
| McLean | 85,655 | 18,930 | 22.1% |
| Menard | 8,194 | 3,018 | 36.83% |
| Mercer | 11,717 | 2,274 | 19.41% |
| Monroe | 18,228 | 6,089 | 33.4% |
| Montgomery | 20,983 | 4,232 | 20.17% |
| Morgan | 20,885 | 4,331 | 20.74% |
| Moultrie | 8,234 | 2,916 | 35.41% |
| Ogle | 28,094 | 6,932 | 24.67% |
| Peoria | 105,139 | 20,889 | 19.87% |
| Perry | 15,388 | 5,828 | 37.87% |
| Piatt | 11,034 | 2,960 | 26.83% |
| Pike | 12,814 | 4,611 | 35.98% |
| Pope | 3,250 | 1,820 | 56.00% |
| Pulaski | 5,470 | 2,445 | 44.70% |
| Putnam | 4,383 | 2,131 | 48.62% |
| Randolph | 23,496 | 8,155 | 34.71% |
| Richland | 12,753 | 4,028 | 31.58% |
| Rock Island | 101,715 | 22,710 | 22.33% |
| Saline | 18,053 | 9,025 | 49.99% |
| Sangamon | 121,984 | 35,680 | 29.25% |
| Schuyler | 5,926 | 2,107 | 35.56% |
| Scott | 3,627 | 1,493 | 41.16% |
| Shelby | 14,326 | 4,857 | 33.9% |
| Stark | 4,540 | 1,135 | 25.00% |
| St. Clair | 153,502 | 29,738 | 19.37% |
| Stephenson | 31,107 | 7,920 | 25.46% |
| Tazewell | 81,769 | 23,112 | 28.26% |
| Union | 14,571 | 6,063 | 41.61% |
| Vermilion | 50,035 | 11,115 | 22.21% |
| Wabash | 9,191 | 2,125 | 23.12% |
| Warren | 11,279 | 2,944 | 26.1% |
| Washington | 10,663 | 2,860 | 26.82% |
| Wayne | 12,773 | 4,263 | 33.38% |
| White | 11,693 | 5,442 | 46.54% |
| Whiteside | 35,370 | 4,726 | 13.36% |
| Will | 229,337 | 53,784 | 23.45% |
| Williamson | 39,063 | 16,509 | 42.26% |
| Winnebago | 158,118 | 29,238 | 18.49% |
| Woodford | 22,924 | 10,050 | 43.84% |
| Total | 6,747,376 | 1,824,806 | 27.04% |
General election
For the general election, turnout was 52.43%, with 3,541,379 votes cast.[2]
- Turnout by county[2]
| County | Registration | Votes cast | Turnout% |
| Adams | 41,285 | 25,575 | 61.95% |
| Alexander | 7,547 | 3,990 | 52.87% |
| Bond | 10,205 | 5,343 | 52.36% |
| Boone | 21,953 | 9,950 | 45.32% |
| Brown | 3,565 | 2,850 | 79.94% |
| Bureau | 24,773 | 15,087 | 60.9% |
| Calhoun | 3,745 | 2,650 | 70.76% |
| Carroll | 10,385 | 6,199 | 59.69% |
| Cass | 9,752 | 4,723 | 48.43% |
| Champaign | 127,069 | 50,026 | 39.37% |
| Christian | 24,112 | 12,302 | 51.02% |
| Clark | 12,197 | 6,517 | 53.43% |
| Clay | 9,254 | 5,354 | 57.86% |
| Clinton | 24,391 | 11,990 | 49.16% |
| Coles | 30,165 | 16,959 | 56.22% |
| Cook[note 2] | 2,625,022 | 1,433,423 | 54.61% |
| Crawford | 13,763 | 7,194 | 52.27% |
| Cumberland | 8,125 | 4,186 | 51.52% |
| DeKalb | 52,659 | 22,131 | 42.03% |
| DeWitt | 10,408 | 5,294 | 50.86% |
| Douglas | 11,637 | 5,911 | 50.79% |
| DuPage | 443,387 | 257,729 | 58.13% |
| Edgar | 13,280 | 7,447 | 56.08% |
| Edwards | 5,127 | 2,971 | 57.95% |
| Effingham | 20,666 | 11,639 | 56.32% |
| Fayette | 14,035 | 8,189 | 58.35% |
| Ford | 8,660 | 5,478 | 63.26% |
| Franklin | 31,202 | 17,097 | 54.79% |
| Fulton | 24,611 | 13,026 | 52.93% |
| Gallatin | 4,704 | 3,215 | 68.35% |
| Greene | 8,769 | 5,047 | 57.56% |
| Grundy | 23,476 | 12,533 | 53.39% |
| Hamilton | 6,487 | 4,368 | 67.33% |
| Hancock | 13,271 | 8,234 | 62.05% |
| Hardin | 3,833 | 2,824 | 73.68% |
| Henderson | 5,493 | 3,578 | 65.14% |
| Henry | 33,838 | 19,022 | 56.21% |
| Iroquois | 18,137 | 11,150 | 61.48% |
| Jackson | 43,168 | 18,919 | 43.83% |
| Jasper | 7,673 | 4,274 | 55.7% |
| Jefferson | 26,587 | 12,683 | 47.7% |
| Jersey | 13,126 | 7,364 | 56.1% |
| Jo Daviess | 15,017 | 8,109 | 54% |
| Johnson | 7,487 | 5,038 | 67.29% |
| Kane | 188,596 | 91,059 | 48.28% |
| Kankakee | 55,176 | 30,720 | 55.68% |
| Kendall | 32,945 | 15,596 | 47.34% |
| Knox | 34,377 | 19,379 | 56.37% |
| Lake | 309,409 | 158,547 | 51.24% |
| LaSalle | 67,876 | 35,919 | 52.92% |
| Lawrence | 9,875 | 5,604 | 56.75% |
| Lee | 21,205 | 11,086 | 52.28% |
| Livingston | 21,433 | 12,212 | 56.98% |
| Logan | 19,243 | 10,772 | 55.98% |
| Macon | 74,913 | 40,772 | 54.43% |
| Macoupin | 35,725 | 15,754 | 44.1% |
| Madison | 170,151 | 74,485 | 43.78% |
| Marion | 29,529 | 12,430 | 42.09% |
| Marshall | 8,564 | 4,467 | 52.16% |
| Mason | 10,192 | 5,331 | 52.31% |
| Massac | 12,760 | 5,669 | 44.43% |
| McDonough | 19,632 | 10,631 | 54.15% |
| McHenry | 150,683 | 66,836 | 44.36% |
| McLean | 94,605 | 39,813 | 42.08% |
| Menard | 8,405 | 5,164 | 61.44% |
| Mercer | 12,025 | 7,093 | 58.99% |
| Monroe | 18,405 | 9,945 | 54.03% |
| Montgomery | 21,153 | 10,255 | 48.48% |
| Morgan | 21,680 | 12,032 | 55.5% |
| Moultrie | 8,208 | 4,670 | 56.9% |
| Ogle | 29,479 | 14,042 | 47.63% |
| Peoria | 110,820 | 54,623 | 49.29% |
| Perry | 15,156 | 9,652 | 63.68% |
| Piatt | 11,197 | 6,351 | 56.72% |
| Pike | 11,903 | 7,532 | 63.28% |
| Pope | 3,332 | 2,284 | 68.55% |
| Pulaski | 6,360 | 3,090 | 48.58% |
| Putnam | 4,167 | 2,529 | 60.69% |
| Randolph | 23,870 | 13,185 | 55.24% |
| Richland | 13,226 | 6,739 | 50.95% |
| Rock Island | 103,597 | 48,714 | 47.02% |
| Saline | 18,579 | 11,664 | 62.78% |
| Sangamon | 118,453 | 76,639 | 64.7% |
| Schuyler | 6,024 | 3,398 | 56.41% |
| Scott | 3,685 | 2,338 | 63.45% |
| Shelby | 14,849 | 8,795 | 59.23% |
| Stark | 4,586 | 2,557 | 55.76% |
| St. Clair | 160,520 | 72,357 | 45.08% |
| Stephenson | 32,197 | 13,674 | 42.47% |
| Tazewell | 84,100 | 40,613 | 48.29% |
| Union | 12,425 | 7,712 | 62.07% |
| Vermilion | 49,454 | 24,994 | 50.54% |
| Wabash | 9,378 | 4,978 | 53.08% |
| Warren | 11,637 | 6,261 | 53.8% |
| Washington | 9,985 | 6,320 | 63.29% |
| Wayne | 12,776 | 7,097 | 55.55% |
| White | 11,646 | 7,662 | 65.79% |
| Whiteside | 36,726 | 17,745 | 48.32% |
| Will | 271,410 | 124,154 | 45.74% |
| Williamson | 40,339 | 24,470 | 60.66% |
| Winnebago | 158,736 | 72,992 | 45.98% |
| Woodford | 23,575 | 12,389 | 52.55% |
| Total | 6,754,998 | 3,541,379 | 52.43% |
Federal elections
United States Senate
Incumbent Democratic United States Senator Carol Moseley Braun lost reelection, being unseated by Republican Peter Fitzgerald.
United States House
All 20 of Illinois' seats in the United States House of Representatives were up for election in 1998.
No seats switched parties, leaving the composition of Illinois' House delegation 10 Democrats and 10 Republicans.
State elections
Governor and Lieutenant Governor
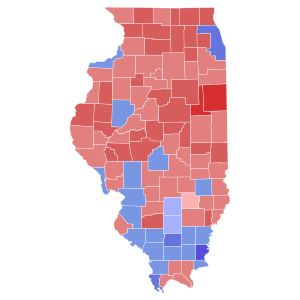
1998 Illinois gubernatorial election
|
|
| Turnout | 49.72% |
|---|
| |
 County results
Ryan: 40–50% 50–60% 60–70% 70–80%
Poshard: 50–60% 60–70% 70–80% 80–90% |
|
Incumbent Governor Jim Edgar, a Republican, did not seek a third term. Republican George Ryan was elected to succeed him.
Governor/Lieutenant Governor election[3] | Party | Candidate | Votes | % |
| | Republican | George Ryan / Corinne Wood | 1,714,094 | 51.03 |
| | Democratic | Glenn Poshard / Mary Lou Kearns | 1,594,191 | 47.46 |
| | Reform | Lawrence Redmond / Phyllis Nirchi | 50,372 | 1.50 |
| | Write-in | Other | 0.00 | 0.00 |
| Total votes | 3,358,705 | 100 |
Attorney General
1998 Illinois Attorney General election
|
|
| Turnout | 49.25% |
|---|
| | | | | Nominee | Jim Ryan | Miriam Santos | | | Party | Republican | Democratic | | Popular vote | 2,026,781 | 1,242,979 | | Percentage | 60.92% | 37.36% | |
 County results
Ryan: 50–60% 60–70% 70–80% 80–90%
Santos: 50–60% |
Attorney General before election
Jim Ryan
Republican | Elected Attorney General
Jim Ryan
Republican | |
Incumbent Attorney General Jim Ryan, a Republican, was reelected to a second term. As of 2022[update] this is the last time a Republican was elected Illinois Attorney General.
Democratic primary
Attorney General Democratic primary[3] | Party | Candidate | Votes | % |
| | Democratic | Miriam Santos | 647,099 | 100 |
| | Democratic | Mister Kawa | 3 | 0.00 |
| Total votes | 647,099 | 100 |
Republican primary
Attorney General Republican primary[3] | Party | Candidate | Votes | % |
| | Republican | Jim Ryan (incumbent) | 643,487 | 100 |
| Total votes | 643,487 | 100 |
Reform primary
Attorney General Reform primary[3] | Party | Candidate | Votes | % |
| | Reform | Jesse M. Dowell, Jr. | 332 | 50.53 |
| | Reform | Daniel J. Kairis | 325 | 49.47 |
| Total votes | 657 | 100 |
General election
Attorney General election[3] | Party | Candidate | Votes | % |
| | Republican | Jim Ryan (incumbent) | 2,026,781 | 60.92 |
| | Democratic | Miriam Santos | 1,242,979 | 37.36 |
| | Reform | Jesse M. Dowell, Jr. | 56,944 | 1.71 |
| Total votes | 3,326,704 | 100 |
Secretary of State
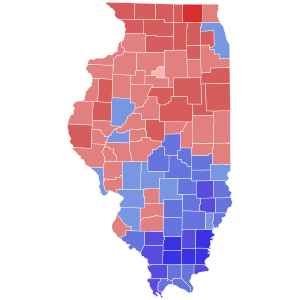
1998 Illinois Secretary of State election
|
|
| Turnout | 50.04% |
|---|
| |  |  | | Nominee | Jesse White | Al Salvi | | | Party | Democratic | Republican | | Popular vote | 1,874,626 | 1,437,420 | | Percentage | 55.46% | 42.53% | |
 County results
White: 40–50% 50–60% 60–70% 70–80%
Salvi: 40–50% 50–60% 60–70% |
Secretary of State before election
George Ryan
Republican | Elected Secretary of State
Jesse White
Democratic | |
Incumbent Secretary of State George Ryan, a Republican, did not seek reelection to a third term in office, instead opting to run for governor. Democrat Jesse White was elected to succeed him in office.
Democratic primary
Secretary of State Democratic primary[3] | Party | Candidate | Votes | % |
| | Democratic | Jesse White | 484,798 | 55.76 |
| | Democratic | Tim McCarthy | 384,603 | 44.24 |
| Total votes | 869,401 | 100 |
Republican primary
Secretary of State Republican primary[3] | Party | Candidate | Votes | % |
| | Republican | Al Salvi | 365,880 | 52.99 |
| | Republican | Robert W. Churchill | 324,529 | 47.01 |
| Total votes | 690,409 | 100 |
Reform primary
Secretary of State Reform primary[3] | Party | Candidate | Votes | % |
| | Reform | Sandra Millatti | 426 | 66.46 |
| | Reform | Maryam Omar | 215 | 33.54 |
| Total votes | 641 | 100 |
General election
Secretary of State election[3] | Party | Candidate | Votes | % |
| | Democratic | Jesse White | 1,874,626 | 55.46 |
| | Republican | Al Salvi | 1,437,420 | 42.53 |
| | Reform | Sandra Millatti | 67,696 | 2.00 |
| | Independent | Therese M. Battaglia | 229 | 0.01 |
| Total votes | 3,379,971 | 100 |
Comptroller
1998 Illinois State Comptroller election
|
|
| Turnout | 47.85% |
|---|
| |
 County results
Hynes: 40–50% 50–60% 60–70% 70–80%
Lauzen: 40–50% 50–60% 60–70% |
|
Incumbent Comptroller Loleta Didrickson, a Republican, did not seek reelection to a second term, instead opting to (ultimately unsuccessfully) run for the Republican nomination for United States Senate. Democrat Daniel Hynes was elected to succeed her in office.
Democratic primary
Comptroller Democratic primary[3] | Party | Candidate | Votes | % |
| | Democratic | Daniel Hynes | 632,141 | 100 |
| Total votes | 632,141 | 100 |
Republican primary
Comptroller Republican primary[3] | Party | Candidate | Votes | % |
| | Republican | Chris Lauzen | 317,766 | 51.48 |
| | Republican | Harry Seigle | 299,469 | 48.52 |
| Total votes | 617,235 | 100 |
Reform primary
Comptroller Reform primary[3] | Party | Candidate | Votes | % |
| | Reform | Houstoun McIntosh Sadler II | 579 | 100 |
| Total votes | 579 | 100 |
General election
Comptroller election[3] | Party | Candidate | Votes | % |
| | Democratic | Daniel Hynes | 1,895,273 | 58.63 |
| | Republican | Chris Lauzen | 1,280,860 | 39.63 |
| | Reform | Houstoun McIntosh Sadler II | 56,219 | 1.74 |
| Total votes | 3,232,352 | 100 |
Treasurer
Incumbent Treasurer Judy Baar Topinka, a Republican, was reelected to a second term.
Democratic primary
Orland Park mayor Daniel J. McLaughlin defeated Calumet City mayor Jerry Genova.[3][4][5]
Treasurer Democratic primary[3] | Party | Candidate | Votes | % |
| | Democratic | Daniel J. McLaughlin | 419,735 | 57.51 |
| | Democratic | Jerry Genova | 310,052 | 42.49 |
| Total votes | 729,787 | 100 |
Republican primary
Treasurer Republican primary[3] | Party | Candidate | Votes | % |
| | Republican | Judy Baar Topinka (incumbent) | 591,932 | 100 |
| Total votes | 591,932 | 100 |
Reform primary
Treasurer Reform primary[3] | Party | Candidate | Votes | % |
| | Reform | Valorie Bain | 338 | 50.90 |
| | Reform | William P. Rakes | 326 | 49.10 |
| Total votes | 664 | 100 |
General election
Treasurer election | Party | Candidate | Votes | % |
| | Republican | Judy Baar Topinka (incumbent) | 1,610,498 | 49.97 |
| | Democratic | Daniel J. McLaughlin | 1,548,219 | 48.04 |
| | Reform | Valorie Bain | 64,001 | 1.99 |
| | Independent | Mark A. Mastrogiovanni | 226 | 0.01 |
| Total votes | 3,222,944 | 100 |
State Senate
Some of the seats of the Illinois Senate were up for election in 1998. Republicans retained control of the chamber.[6]
State House of Representatives
All of the seats in the Illinois House of Representatives were up for election in 1998. Democrats retained control of the chamber.[6]
Judicial elections
Multiple judicial positions were up for election in 1998.
Ballot measure
Illinois voters voted on a single ballot measure in 1998.[7] In order to be approved, the measures required either 60% support among those specifically voting on the amendment or 50% support among all ballots cast in the elections.[7]
Illinois Courts Commission Amendment
Voters approved the Illinois Courts Commission Amendment, a legislatively referred constitutional amendment which amended Article VI, Section 15 of the Constitution of Illinois to make modifications to the courts commission.[7][8]
| Illinois Courts Commission Amendment[2][7] |
| Option | Votes | % of votes
on measure | % of all ballots
cast |
| Yes | 1,677,109 | 80.47 | 47.37 |
| No | 407,014 | 19.53 | 11.49 |
| Total votes | 2,084,123 | 100 | 58.85 |
| Voter turnout | 30.85% |
Local elections
Local elections were held. These included county elections, such as the Cook County elections.
Notes
References
- ^ "Illinois Primary Results - March 17, 1998". www.cnn.com. CNN. Retrieved March 26, 2020.
- ^ a b c d e "Voter Turnout". www.elections.il.gov. Illinois State Board of Elections. Archived from the original on May 30, 2021. Retrieved March 25, 2020.
- ^ a b c d e f g h i j k l m n o p q "Election Results". www.elections.il.gov. Illinois State Board of Elections. Archived from the original on February 22, 2020. Retrieved March 23, 2020.
- ^ "ORLAND MOVES TO CONTROL GROWTH". Crain's Chicago Business. August 6, 1994. Retrieved April 7, 2020.
- ^ O'Connor, Matt (March 14, 2002). "Ex-Cal City chief gets prison term". chicagotribune.com. Chicago Tribune. Retrieved March 26, 2020.
- ^ a b "Party control of Illinois state government". Ballotpedia. Retrieved March 26, 2020.
- ^ a b c d "Illinois Constitution - Amendments Proposed". www.ilga.gov. Illinois General Assembly. Retrieved March 26, 2020.
- ^ "Illinois Courts Commission, Amendment 1 (1998)". Ballotpedia. Retrieved March 29, 2020.
|
|---|
U.S.
Senate | |
|---|
U.S.
House | |
|---|
| Governors | |
|---|
Attorneys
General | |
|---|
State
legislatures | - Arizona
- California
- Iowa
- Maryland
- House
- Texas
|
|---|
| State officials | |
|---|
States
generally | - Alabama
- Alaska
- Arizona
- Arkansas
- California
- Colorado
- Connecticut
- Delaware
- Florida
- Georgia
- Hawaii
- Idaho
- Illinois
- Indiana
- Iowa
- Kansas
- Kentucky
- Louisiana
- Maine
- Maryland
- Massachusetts
- Michigan
- Minnesota
- Mississippi
- Missouri
- Montana
- Nebraska
- Nevada
- New Hampshire
- New Jersey
- New Mexico
- New York
- North Carolina
- North Dakota
- Ohio
- Oklahoma
- Oregon
- Pennsylvania
- Rhode Island
- South Carolina
- South Dakota
- Tennessee
- Texas
- Utah
- Vermont
- Virginia
- Washington
- West Virginia
- Wisconsin
- Wyoming
|
|---|
| Mayors | |
|---|