Part of the 1985 Irish local elections
1985 Roscommon County Council election
|
| ← 1979 | 20 June 1985 | 1991 → |
|
All 26 seats on Roscommon County Council |
|---|
| | First party | Second party | Third party | | | | | | | Party | Fianna Fáil | Fine Gael | Independent | | Seats won | 13 | 8 | 5 | | Seat change | +1 | -4 | +4 |
| | | Fourth party | | | | | | | Party | Sinn Féin | | | Seats won | 0 | | | Seat change | -1 | | |
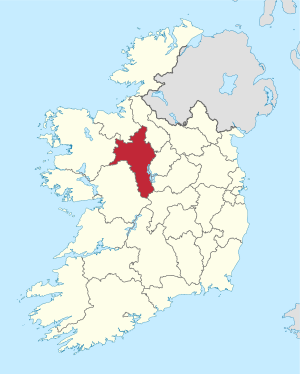 Map showing the area of Roscommon County Council |
| | Council control after election
TBD
| |
An election to Roscommon County Council took place on 20 June 1985 as part of the Irish local elections. 26 councillors were elected from six local electoral areas (LEAs) for a five-year term of office on the electoral system of proportional representation by means of the single transferable vote (PR-STV). This term was extended for a further year, to 1991.[1]
Results by party
| Party | Seats | ± | First Pref. votes | FPv% | ±% |
| | Fianna Fáil | 13 | +1 | 13,230 | 44.86 | |
| | Fine Gael | 8 | -4 | 10,648 | 36.10 | |
| | Independent | 5 | +4 | 4,661 | 15.80 | |
| | Sinn Féin | 0 | -1 | 948 | 3.21 | |
| Totals | 26 | - | 29,495 | 100.00 | — |
Results by local electoral area
Athlone
Athlone: 4 seats | Party | Candidate | FPv% | Count |
| 1 | 2 | 3 | 4 | 5 |
| | Fianna Fáil | Michael Finneran* | | 1,522 | | | | |
| | Fine Gael | Liam Naughten TD* | | 1,379 | | | | |
| | Independent | Patrick Lenihan* | | 1,274 | | | | |
| | Fianna Fáil | Jim Morris | | 448 | 825 | 870 | 905 | 1,091 |
| | Fine Gael | John Joe Grenham* | | 387 | 437 | 627 | 840 | 884 |
| | Fine Gael | Willie Nestor | | 208 | 259 | 359 | | |
| Electorate: 6,686 Valid: 5,218 (78.79%) Spoilt: 50 Quota: 1,044 Turnout: 5,268 |
Ballaghadreen
Ballaghadreen: 4 seats | Party | Candidate | FPv% | Count |
| 1 | 2 | 3 | 4 | 5 |
| | Fine Gael | Sen. John Connor | | 881 | | | | |
| | Fianna Fáil | Patrick Dooney* | | 795 | 806 | 951 | | |
| | Fine Gael | Michael Scally | | 636 | 793 | 819 | 821 | 832 |
| | Fianna Fáil | Paul Lynch | | 633 | 656 | 762 | 833 | 834 |
| | Independent | Tom McGarry* | | 568 | 652 | 818 | 830 | 834 |
| | Fianna Fáil | Hubert Maxwell | | 479 | 508 | | | |
| | Fine Gael | Michael Gilligan* | | 332 | | | | |
| Electorate: 6,498 Valid: 4,325 (67.04%) Spoilt: 31 Quota: 866 Turnout: 4,356 |
Boyle
Boyle: 5 seats | Party | Candidate | FPv% | Count |
| 1 | 2 | 3 | 4 | 5 | 6 | 7 |
| | Fianna Fáil | Sean Doherty TD* | | 1,263 | | | | | | |
| | Fianna Fáil | Sean McQuaid | | 652 | 758 | 797 | 843 | 977 | | |
| | Fianna Fáil | Colm O'Donnell* | | 595 | 696 | 718 | 765 | 862 | 926 | |
| | Fine Gael | Thomas Egan* | | 574 | 595 | 705 | 748 | 760 | 761 | 830 |
| | Fine Gael | Charlie Hopkins | | 514 | 528 | 573 | 619 | 624 | 625 | 680 |
| | Fine Gael | Charles Duignan* | | 500 | 523 | 557 | 575 | 606 | 608 | 909 |
| | Fine Gael | John Beirne* | | 444 | 458 | 480 | 499 | 579 | 579 | |
| | Fianna Fáil | Timothy Cooney | | 327 | 379 | 383 | 421 | | | |
| | Sinn Féin | Kevin Earley | | 296 | 310 | 319 | | | | |
| | Fine Gael | Connie Fallon | | 283 | 292 | | | | | |
| Electorate: 7,103 Valid: 5,448 (77.64%) Spoilt: 67 Quota: 909 Turnout: 5,515 |
Castlerea
Castlerea: 4 seats | Party | Candidate | FPv% | Count |
| 1 | 2 | 3 | 4 | 5 | 6 | 7 |
| | Independent | Patrick Moylan* | | 714 | 755 | 845 | | | | |
| | Fine Gael | Michael McGreal | | 579 | 601 | 625 | 634 | 691 | 711 | 713 |
| | Independent | Paddy Concannon* | | 550 | 553 | 556 | 556 | 668 | 780 | 837 |
| | Fine Gael | Tom Callaghan* | | 526 | 528 | 528 | 529 | 588 | 657 | 681 |
| | Independent | Tony Waldron | | 473 | 481 | 489 | 493 | | | |
| | Fianna Fáil | John Costello* | | 443 | 446 | 516 | 528 | 665 | 957 | |
| | Fianna Fáil | Liam Satchwell | | 429 | 434 | 498 | 503 | 579 | | |
| | Fianna Fáil | Gerard Regan | | 263 | 271 | | | | | |
| | Independent | Michael Mitchell | | 96 | | | | | | |
| Electorate: 5,412 Valid: 4,074 (76.07%) Spoilt: 43 Quota: 815 Turnout: 4,117 |
Roscommon
Roscommon: 5 seats | Party | Candidate | FPv% | Count |
| 1 | 2 | 3 | 4 | 5 | 6 |
| | Fianna Fáil | Terry Leyden TD* | | 1,101 | | | | | |
| | Independent | Eithne Quinn | | 986 | | | | | |
| | Fianna Fáil | Anthony Murray | | 609 | 655 | 670 | 756 | 824 | 930 |
| | Fianna Fáil | Des Bruen* | | 549 | 632 | 654 | 786 | 806 | 830 |
| | Fine Gael | Patrick Walshe* | | 515 | 529 | 549 | 580 | 722 | 901 |
| | Fine Gael | John T. Kirwan | | 446 | 453 | 464 | 473 | 526 | |
| | Fine Gael | Tom Hunt* | | 402 | 418 | 433 | 472 | 581 | 742 |
| | Fianna Fáil | Seamus Keane | | 382 | 394 | 403 | 429 | | |
| | Fianna Fáil | Seamus McDermott | | 316 | 359 | 367 | | | |
| Electorate: 7,607 Valid: 5,312 (70.28%) Spoilt: 34 Quota: 886 Turnout: 5,346 |
Strokestown
References
- ^ Local Elections (Specification of Local Election Year) Order 1990 (S.I. No. 104 of 1990). Signed on 30 April 1990. Statutory Instrument of the Government of Ireland. Retrieved from Irish Statute Book.
External links
- Official website[permanent dead link]
- Irishelectionliterature
- Department of the Environment, Ireland (28 January 2010). "Local elections, 1985 : election results and transfer of votes in respect of each county, and county borough council : and election statistics relating to all local authorities" (PDF). Department of the Environment. Retrieved 28 October 2019.


